Quick Links
- Executive Summary
- Preamble & Section 1
- Appropriations Recommendations
- Line Item Summary
- Local Aid to Cities and Towns
- Outside Sections
- Financial Statements
- Operating Transfers
- Tax Expenditure Budget
- Downloads
- Related Legislation
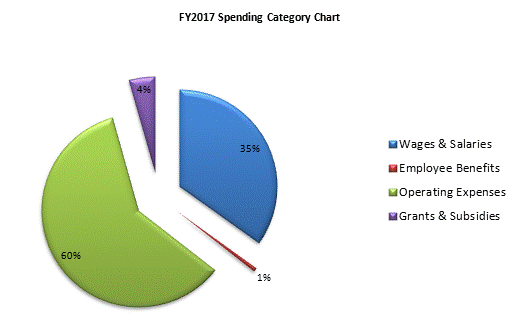
Office of the Secretary of Education
| SPENDING CATEGORY |
FY2013 Expended |
FY2014 Expended |
FY2015 Expended |
FY2016 Projected Spending * |
FY2017 House 2 |
|---|---|---|---|---|---|
| Wages & Salaries | 5,463 | 6,555 | 8,575 | 8,134 | 8,109 |
| Employee Benefits | 83 | 116 | 152 | 149 | 149 |
| Operating Expenses | 7,815 | 11,522 | 11,991 | 13,059 | 13,959 |
| Safety Net | 0 | 19 | 0 | 0 | 0 |
| Grants & Subsidies | 909 | 3,353 | 3,058 | 2,379 | 1,007 |
| TOTAL | 14,271 | 21,566 | 23,776 | 23,721 | 23,224 |

 top of page