Quick Links
- Executive Summary
- Preamble & Section 1
- Appropriations Recommendations
- Judiciary
- Independents
- District Attorneys
- Sheriffs
- Governor's Office
- Secretary of State
- Treasurer
- State Auditor
- Attorney General
- State Ethics Commission
- Inspector General
- Campaign Finance
- Comm. Against Discrimination
- Status of Women
- Disabled Persons Protection
- Library Commissioners
- Comptroller
- Office of the Child Advocate
- Mass Gaming Commission
- Center for Health Info and Analysis
- Administration and Finance
- Energy & Environmental Affairs
- Health and Human Services
- Transportation
- Housing & Economic Development
- Labor & Workforce Development
- Education
- Public Safety
- Legislature
- Line Item Summary
- Local Aid to Cities and Towns
- Outside Sections
- Financial Statements
- Operating Transfers
- Tax Expenditure Budget
- Downloads
- Related Legislation
Independent Agencies and Constitutional Officers
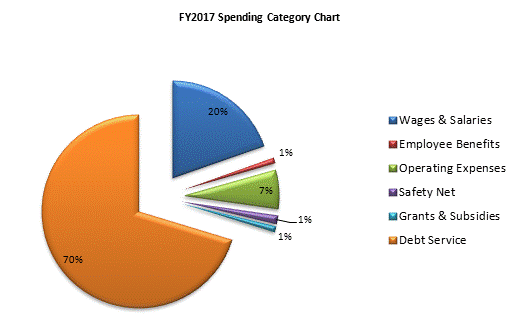
| SPENDING CATEGORY |
FY2013 Expended |
FY2014 Expended |
FY2015 Expended |
FY2016 Projected Spending * |
FY2017 House 2 |
|---|---|---|---|---|---|
| Wages & Salaries | 609,448 | 642,106 | 674,255 | 720,614 | 700,386 |
| Employee Benefits | 28,706 | 35,246 | 31,874 | 33,563 | 33,885 |
| Operating Expenses | 203,532 | 363,373 | 710,791 | 223,476 | 235,897 |
| Safety Net | 46,989 | 92,409 | 43,021 | 44,962 | 52,286 |
| Grants & Subsidies | 25,643 | 64,297 | 33,636 | 35,388 | 35,819 |
| Debt Service | 2,208,692 | 2,225,579 | 2,303,051 | 2,377,068 | 2,502,361 |
| TOTAL | 3,123,010 | 3,423,010 | 3,796,627 | 3,435,071 | 3,560,634 |
 top of page