Quick Links
- Executive Summary
- Preamble & Section 1
- Appropriations Recommendations
- Line Item Summary
- Local Aid to Cities and Towns
- Outside Sections
- Financial Statements
- Operating Transfers
- Tax Expenditure Budget
- Downloads
- Related Legislation
Executive Office of Housing and Economic Development
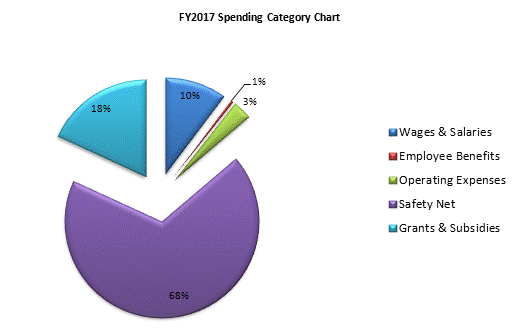
| SPENDING CATEGORY |
FY2013 Expended |
FY2014 Expended |
FY2015 Expended |
FY2016 Projected Spending * |
FY2017 House 2 |
|---|---|---|---|---|---|
| Wages & Salaries | 46,293 | 55,774 | 58,957 | 51,792 | 54,831 |
| Employee Benefits | 1,869 | 2,101 | 2,138 | 2,260 | 2,261 |
| Operating Expenses | 12,213 | 12,453 | 13,286 | 13,701 | 17,190 |
| Safety Net | 309,825 | 349,650 | 337,840 | 372,220 | 367,992 |
| Grants & Subsidies | 89,308 | 120,772 | 108,300 | 124,267 | 97,923 |
| Debt Service | 0 | 0 | 0 | 11,952 | 0 |
| TOTAL | 459,508 | 540,751 | 520,520 | 576,191 | 540,197 |

 top of page