Quick Links
- Executive Summary
- Preamble & Section 1
- Appropriations Recommendations
- Judiciary
- Independents
- Administration and Finance
- Energy & Environmental Affairs
- Health and Human Services
- Health & Human Services
- Elder Affairs
- Public Health
- Mental Health
- Refugees and Immigrants
- Youth Services
- Transitional Assistance
- Children and Families
- Mass Commission for the Blind
- Mass Rehabilitation Commission
- Mass Commission for the Deaf
- Soldiers' Home, Chelsea
- Soldiers' Home, Holyoke
- Developmental Services
- Veterans' Services
- Transportation
- Housing & Economic Development
- Labor & Workforce Development
- Education
- Public Safety
- Legislature
- Line Item Summary
- Local Aid to Cities and Towns
- Outside Sections
- Financial Statements
- Operating Transfers
- Tax Expenditure Budget
- Downloads
- Related Legislation
Office of the Secretary of Health and Human Services
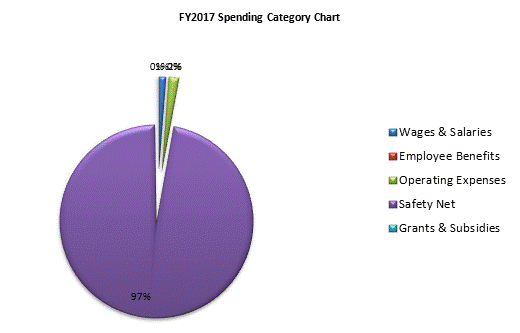
| SPENDING CATEGORY |
FY2013 Expended |
FY2014 Expended |
FY2015 Expended |
FY2016 Projected Spending * |
FY2017 House 2 |
|---|---|---|---|---|---|
| Wages & Salaries | 103,846 | 113,201 | 121,560 | 120,466 | 140,839 |
| Employee Benefits | 1,520 | 1,750 | 2,073 | 1,986 | 2,037 |
| Operating Expenses | 98,188 | 113,822 | 269,490 | 203,573 | 213,747 |
| Safety Net | 8,407,277 | 9,185,335 | 10,266,016 | 12,311,551 | 12,183,171 |
| Grants & Subsidies | 7,092 | 49,707 | 6,360 | 30,725 | 30,525 |
| TOTAL | 8,617,924 | 9,463,815 | 10,665,500 | 12,668,302 | 12,570,319 |

 top of page