Quick Links
- Executive Summary
- Preamble & Section 1
- Appropriations Recommendations
- Judiciary
- Independents
- Administration and Finance
- Energy & Environmental Affairs
- Health and Human Services
- Health & Human Services
- Elder Affairs
- Public Health
- Mental Health
- Refugees and Immigrants
- Youth Services
- Transitional Assistance
- Children and Families
- Mass Commission for the Blind
- Mass Rehabilitation Commission
- Mass Commission for the Deaf
- Soldiers' Home, Chelsea
- Soldiers' Home, Holyoke
- Developmental Services
- Veterans' Services
- Transportation
- Housing & Economic Development
- Labor & Workforce Development
- Education
- Public Safety
- Legislature
- Line Item Summary
- Local Aid to Cities and Towns
- Outside Sections
- Financial Statements
- Operating Transfers
- Tax Expenditure Budget
- Downloads
- Related Legislation
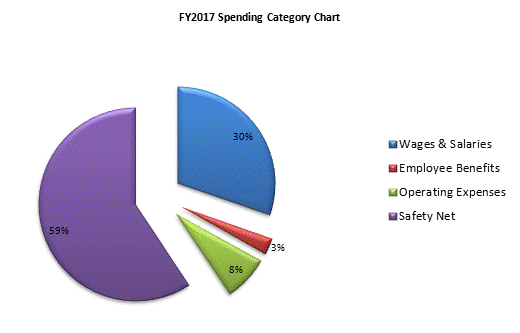
Department of Youth Services
| SPENDING CATEGORY |
FY2013 Expended |
FY2014 Expended |
FY2015 Expended |
FY2016 Projected Spending * |
FY2017 House 2 |
|---|---|---|---|---|---|
| Wages & Salaries | 45,938 | 47,814 | 50,305 | 52,561 | 53,549 |
| Employee Benefits | 4,340 | 4,244 | 4,696 | 4,287 | 4,901 |
| Operating Expenses | 10,430 | 13,534 | 12,701 | 13,323 | 13,431 |
| Safety Net | 90,485 | 95,491 | 100,567 | 106,901 | 104,725 |
| TOTAL | 151,193 | 161,083 | 168,270 | 177,071 | 176,607 |

 top of page