Quick Links
Volume 1
Volume 2
- Budget Development
- Financial Statements
- Capital Budget
- Appropriation Recommendations
- Appropriations - Chrome Users
- Preamble & Sections 1-1C
- Section 2 Preambles
- Judiciary
- Independents
- Administration and Finance
- Energy & Environmental Affairs
- Health and Human Services
- Health & Human Services
- Elder Affairs
- Public Health
- Mental Health
- Refugees and Immigrants
- Youth Services
- Transitional Assistance
- Children and Families
- Mass Commission for the Blind
- Mass Rehabilitation Commission
- Mass Commission for the Deaf
- Soldiers' Home, Chelsea
- Soldiers' Home, Holyoke
- Developmental Services
- Veterans' Services
- Transportation
- Housing & Economic Development
- Labor & Workforce Development
- Education
- Public Safety
- Legislature
- Line Item Summary
- Agency Information
- Operating Transfers
- Local Aid - Section 3
- Outside Sections
- Tax Expenditure Budget
- Resources - PDF Files
4200-0300 - Residential Services for Committed Population
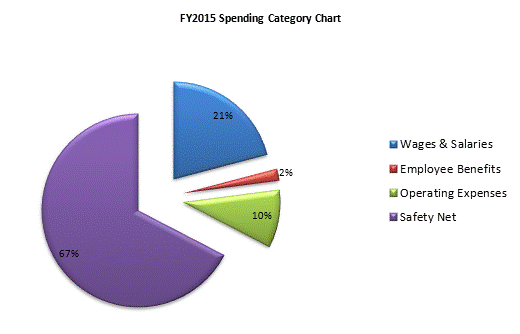
| SPENDING CATEGORY |
FY2011 Expended |
FY2012 Expended |
FY2013 Expended |
FY2014 Projected Spending * |
FY2015 House 2 |
|---|---|---|---|---|---|
| Wages & Salaries | 20,314 | 20,612 | 21,886 | 23,590 | 24,799 |
| Employee Benefits | 1,419 | 1,859 | 1,931 | 2,248 | 2,348 |
| Operating Expenses | 8,637 | 8,326 | 9,024 | 11,202 | 11,442 |
| Safety Net | 65,292 | 65,417 | 67,493 | 74,456 | 79,759 |
| TOTAL | 95,663 | 96,213 | 100,334 | 111,496 | 118,348 |

 top of page