Quick Links
Volume 1
Volume 2
- Budget Development
- Financial Statements
- Capital Budget
- Appropriation Recommendations
- Appropriations - Chrome Users
- Preamble & Sections 1-1C
- Section 2 Preambles
- Judiciary
- Independents
- Administration and Finance
- Administration & Finance
- Dev. Disabilities Council
- Capital Asset Management
- Bureau of the State House
- Office on Disability
- Teachers' Retirement Board
- Group Insurance
- Public Employee Retirement
- Administrative Law Appeals
- George Fingold Library
- Dept. of Revenue
- Appellate Tax Board
- Health Policy Commission
- Human Resources Division
- Civil Service Commission
- Operational Services Division
- Information Technology
- Energy & Environmental Affairs
- Health and Human Services
- Transportation
- Housing & Economic Development
- Labor & Workforce Development
- Education
- Public Safety
- Legislature
- Line Item Summary
- Agency Information
- Operating Transfers
- Local Aid - Section 3
- Outside Sections
- Tax Expenditure Budget
- Resources - PDF Files
Administration and Finance
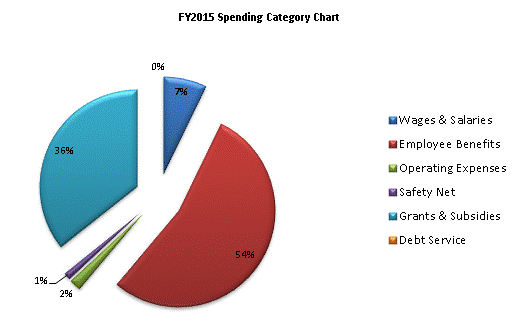
| SPENDING CATEGORY |
FY2011 Expended |
FY2012 Expended |
FY2013 Expended |
FY2014 Projected Spending * |
FY2015 House 2 |
|---|---|---|---|---|---|
| Wages & Salaries | 220,185 | 171,919 | 238,725 | 222,905 | 255,889 |
| Employee Benefits | 1,315,178 | 1,655,722 | 1,719,394 | 1,810,757 | 1,915,382 |
| Operating Expenses | 868,332 | 59,011 | 67,836 | 86,847 | 69,887 |
| Safety Net | 210,940 | 633,210 | 688,425 | 418,032 | 42,917 |
| Grants & Subsidies | 1,090,974 | 1,112,604 | 1,098,201 | 1,190,654 | 1,267,190 |
| Debt Service | 382 | 380 | 192 | 87 | 87 |
| TOTAL | 3,705,991 | 3,632,846 | 3,812,773 | 3,729,282 | 3,551,352 |

 top of page