Quick Links
Volume 1
Volume 2
- Budget Development
- Financial Statements
- Capital Budget
- Appropriation Recommendations
- Appropriations - Chrome Users
- Agency Information
- Operating Transfers
- Local Aid - Section 3
- Outside Sections
- Tax Expenditure Budget
- Resources - PDF Files
Executive Office of Education
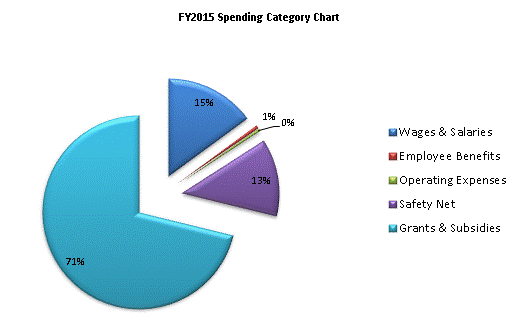
| SPENDING CATEGORY |
FY2011 Expended |
FY2012 Expended |
FY2013 Expended |
FY2014 Projected Spending * |
FY2015 House 2 |
|---|---|---|---|---|---|
| Wages & Salaries | 896,031 | 881,879 | 937,979 | 961,099 | 998,533 |
| Employee Benefits | 15,390 | 14,603 | 12,268 | 35,385 | 35,398 |
| Operating Expenses | 15,933 | 17,153 | 21,466 | 25,753 | 28,436 |
| Safety Net | 692,112 | 755,563 | 773,485 | 848,725 | 865,949 |
| Grants & Subsidies | 4,105,130 | 4,246,555 | 4,461,786 | 4,639,080 | 4,761,796 |
| TOTAL | 5,724,596 | 5,915,752 | 6,206,984 | 6,510,041 | 6,690,112 |

 top of page