Quick Links
Volume 1
Volume 2
- Budget Development
- Financial Statements
- Capital Budget
- Appropriation Recommendations
- Appropriations - Chrome Users
- Agency Information
- Operating Transfers
- Local Aid - Section 3
- Outside Sections
- Tax Expenditure Budget
- Resources - PDF Files
Public Safety and Security
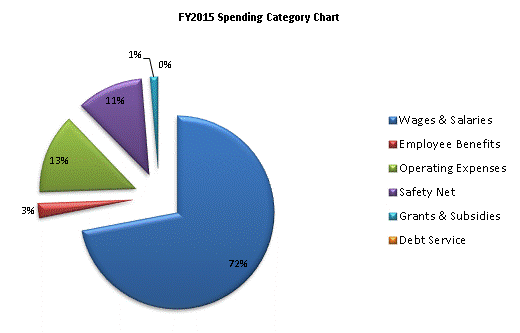
| SPENDING CATEGORY |
FY2011 Expended |
FY2012 Expended |
FY2013 Expended |
FY2014 Projected Spending * |
FY2015 House 2 |
|---|---|---|---|---|---|
| Wages & Salaries | 637,072 | 656,296 | 686,940 | 726,516 | 730,130 |
| Employee Benefits | 27,365 | 26,561 | 21,973 | 24,613 | 24,710 |
| Operating Expenses | 117,377 | 115,850 | 118,950 | 137,232 | 134,889 |
| Safety Net | 110,632 | 113,973 | 115,345 | 106,618 | 111,594 |
| Grants & Subsidies | 18,148 | 13,834 | 14,573 | 17,280 | 12,481 |
| Debt Service | 0 | 75 | 97 | 97 | 97 |
| TOTAL | 910,594 | 926,590 | 957,879 | 1,012,355 | 1,013,901 |

 top of page