Quick Links
Volume 1
Volume 2
- Budget Development
- Financial Statements
- Capital Budget
- Appropriation Recommendations
- Appropriations - Chrome Users
- Preamble & Sections 1-1C
- Section 2 Preambles
- Judiciary
- Independents
- District Attorneys
- Sheriffs
- Governor's Office
- Secretary of State
- Treasurer
- State Auditor
- Attorney General
- State Ethics Commission
- Inspector General
- Campaign Finance
- Comm. Against Discrimination
- Status of Women
- Disabled Persons Protection
- Library Commissioners
- Comptroller
- Center for Health Info and Analysis
- Administration and Finance
- Energy & Environmental Affairs
- Health and Human Services
- Transportation
- Housing & Economic Development
- Labor & Workforce Development
- Education
- Public Safety
- Legislature
- Line Item Summary
- Agency Information
- Operating Transfers
- Local Aid - Section 3
- Outside Sections
- Tax Expenditure Budget
- Resources - PDF Files
Independent Agencies and Constitutional Officers
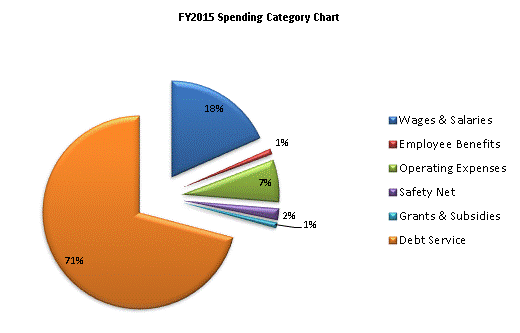
| SPENDING CATEGORY |
FY2011 Expended |
FY2012 Expended |
FY2013 Expended |
FY2014 Projected Spending * |
FY2015 House 2 |
|---|---|---|---|---|---|
| Wages & Salaries | 576,829 | 590,752 | 609,448 | 600,986 | 614,339 |
| Employee Benefits | 32,404 | 32,412 | 28,707 | 32,265 | 32,698 |
| Operating Expenses | 192,322 | 269,192 | 674,336 | 231,526 | 231,139 |
| Safety Net | 39,008 | 52,463 | 46,989 | 49,838 | 64,917 |
| Grants & Subsidies | 798,697 | 23,662 | 25,643 | 27,794 | 31,291 |
| Debt Service | 1,801,224 | 2,019,378 | 2,208,692 | 2,297,436 | 2,372,321 |
| TOTAL | 3,440,486 | 2,987,859 | 3,593,815 | 3,239,844 | 3,346,704 |

 top of page