Quick Links
Volume 1
Volume 2
- Budget Development
- Financial Statements
- Capital Budget
- Appropriation Recommendations
- Appropriations - Chrome Users
- Agency Information
- Operating Transfers
- Local Aid - Section 3
- Outside Sections
- Tax Expenditure Budget
- Resources - PDF Files
Department of Elementary and Secondary Education
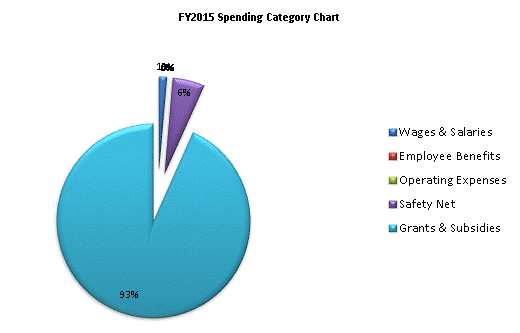
| SPENDING CATEGORY |
FY2011 Expended |
FY2012 Expended |
FY2013 Expended |
FY2014 Projected Spending * |
FY2015 House 2 |
|---|---|---|---|---|---|
| Wages & Salaries | 49,191 | 46,966 | 52,820 | 58,001 | 59,303 |
| Employee Benefits | 456 | 473 | 416 | 493 | 472 |
| Operating Expenses | 5,458 | 5,532 | 5,599 | 6,166 | 6,240 |
| Safety Net | 148,561 | 229,015 | 255,546 | 266,806 | 266,983 |
| Grants & Subsidies | 4,060,259 | 4,201,135 | 4,414,599 | 4,550,037 | 4,644,896 |
| TOTAL | 4,263,925 | 4,483,121 | 4,728,980 | 4,881,502 | 4,977,894 |

 top of page