Quick Links
Volume 1
Volume 2
- Budget Development
- Financial Statements
- Capital Budget
- Appropriation Recommendations
- Appropriations - Chrome Users
- Preamble & Sections 1-1C
- Section 2 Preambles
- Judiciary
- Independents
- Administration and Finance
- Energy & Environmental Affairs
- Health and Human Services
- Health & Human Services
- Elder Affairs
- Public Health
- Mental Health
- Refugees and Immigrants
- Youth Services
- Transitional Assistance
- Children and Families
- Mass Commission for the Blind
- Mass Rehabilitation Commission
- Mass Commission for the Deaf
- Soldiers' Home, Chelsea
- Soldiers' Home, Holyoke
- Developmental Services
- Veterans' Services
- Transportation
- Housing & Economic Development
- Labor & Workforce Development
- Education
- Public Safety
- Legislature
- Line Item Summary
- Agency Information
- Operating Transfers
- Local Aid - Section 3
- Outside Sections
- Tax Expenditure Budget
- Resources - PDF Files
Department of Transitional Assistance
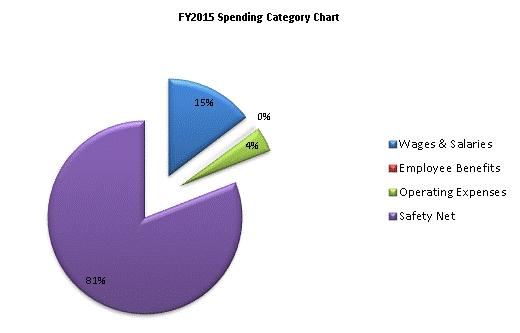
| SPENDING CATEGORY |
FY2011 Expended |
FY2012 Expended |
FY2013 Expended |
FY2014 Projected Spending * |
FY2015 House 2 |
|---|---|---|---|---|---|
| Wages & Salaries | 82,718 | 88,055 | 96,196 | 105,074 | 108,184 |
| Employee Benefits | 1,997 | 2,083 | 1,627 | 1,982 | 1,984 |
| Operating Expenses | 26,786 | 27,293 | 28,583 | 33,438 | 30,321 |
| Safety Net | 658,550 | 649,953 | 631,181 | 619,144 | 596,567 |
| Grants & Subsidies | 0 | 0 | 0 | 0 | 0 |
| TOTAL | 770,051 | 767,384 | 757,587 | 759,637 | 737,055 |

 top of page