Quick Links
Volume 1
Volume 2
- Budget Development
- Financial Statements
- Capital Budget
- Appropriation Recommendations
- Appropriations - Chrome Users
- Preamble & Sections 1-1C
- Section 2 Preambles
- Judiciary
- Independents
- Administration and Finance
- Energy & Environmental Affairs
- Health and Human Services
- Health & Human Services
- Elder Affairs
- Public Health
- Mental Health
- Refugees and Immigrants
- Youth Services
- Transitional Assistance
- Children and Families
- Mass Commission for the Blind
- Mass Rehabilitation Commission
- Mass Commission for the Deaf
- Soldiers' Home, Chelsea
- Soldiers' Home, Holyoke
- Developmental Services
- Veterans' Services
- Transportation
- Housing & Economic Development
- Labor & Workforce Development
- Education
- Public Safety
- Legislature
- Line Item Summary
- Agency Information
- Operating Transfers
- Local Aid - Section 3
- Outside Sections
- Tax Expenditure Budget
- Resources - PDF Files
Massachusetts Rehabilitation Commission
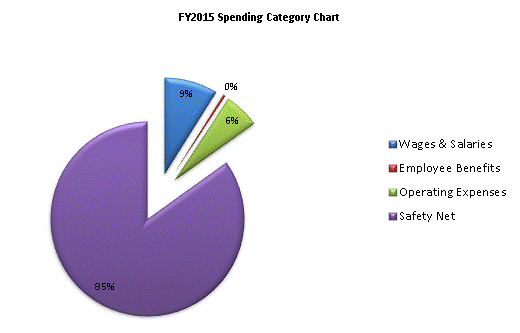
| SPENDING CATEGORY |
FY2011 Expended |
FY2012 Expended |
FY2013 Expended |
FY2014 Projected Spending * |
FY2015 House 2 |
|---|---|---|---|---|---|
| Wages & Salaries | 3,966 | 4,111 | 3,987 | 4,223 | 4,305 |
| Employee Benefits | 201 | 199 | 173 | 193 | 193 |
| Operating Expenses | 2,838 | 2,832 | 2,722 | 2,839 | 2,875 |
| Safety Net | 33,205 | 33,787 | 33,950 | 37,454 | 41,343 |
| TOTAL | 40,210 | 40,929 | 40,832 | 44,709 | 48,717 |

 top of page