- Executive Summary
- Preamble & Section 1
- Appropriations Recommendation
- Line Item Summary
- Local Aid to Cities and Towns
- Outside Sections
- Financial Statements
- Operating Transfers
- Tax Expenditure Budget
- Downloads
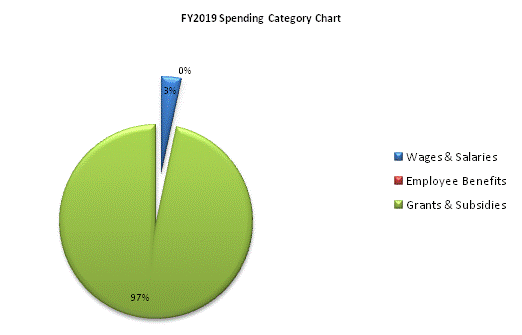
7066-0040 - Bridges to College
| SPENDING CATEGORY |
FY2015 Expended |
FY2016 Expended |
FY2017 Expended |
FY2018 Projected Spending |
FY2019 House 2 |
|---|---|---|---|---|---|
| Wages & Salaries | 107 | 24 | 12 | 12 | 12 |
| Employee Benefits | 2 | 0 | 0 | 0 | 0 |
| Operating Expenses | 12 | 5 | 0 | 0 | 0 |
| Safety Net | 5 | 0 | 0 | 0 | 0 |
| Grants & Subsidies | 285 | 237 | 237 | 228 | 365 |
| Other | 0 | 0 | 0 | 135 | 0 |
| TOTAL | 411 | 266 | 250 | 375 | 378 |

 top of page