- Executive Summary
- Preamble & Section 1
- Appropriations Recommendation
- Line Item Summary
- Local Aid to Cities and Towns
- Outside Sections
- Financial Statements
- Operating Transfers
- Tax Expenditure Budget
- Downloads
7009-1700 - Education Information Technology Costs
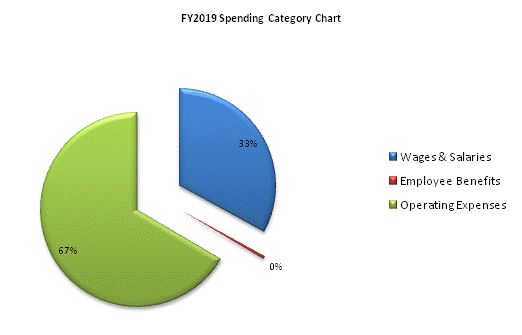
| SPENDING CATEGORY |
FY2015 Expended |
FY2016 Expended |
FY2017 Expended |
FY2018 Projected Spending |
FY2019 House 2 |
|---|---|---|---|---|---|
| Wages & Salaries | 6,332 | 5,954 | 5,873 | 5,934 | 6,003 |
| Employee Benefits | 110 | 103 | 106 | 92 | 93 |
| Operating Expenses | 10,454 | 11,525 | 11,358 | 11,682 | 12,135 |
| TOTAL | 16,895 | 17,582 | 17,337 | 17,708 | 18,231 |

 top of page