- Executive Summary
- Preamble & Section 1
- Appropriations Recommendation
- Judiciary
- Independents
- Administration and Finance
- Tech Services and Security
- Energy & Environmental Affairs
- Health and Human Services
- Health & Human Services
- Elder Affairs
- Public Health
- Mental Health
- Refugees and Immigrants
- Youth Services
- Transitional Assistance
- Children and Families
- Mass Commission for the Blind
- Mass Rehabilitation Commission
- Mass Commission for the Deaf
- Soldiers' Home, Chelsea
- Soldiers' Home, Holyoke
- Developmental Services
- Veterans' Services
- Transportation
- Housing & Economic Development
- Labor & Workforce Development
- Education
- Public Safety
- Legislature
- Line Item Summary
- Local Aid to Cities and Towns
- Outside Sections
- Financial Statements
- Operating Transfers
- Tax Expenditure Budget
- Downloads
4513-1111 - Health Promotion and Disease Prevention
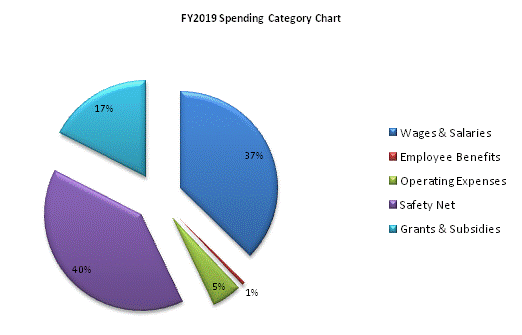
| SPENDING CATEGORY |
FY2015 Expended |
FY2016 Expended |
FY2017 Expended |
FY2018 Projected Spending |
FY2019 House 2 |
|---|---|---|---|---|---|
| Wages & Salaries | 962 | 1,107 | 977 | 1,277 | 1,282 |
| Employee Benefits | 14 | 16 | 19 | 20 | 20 |
| Operating Expenses | 139 | 76 | 97 | 169 | 172 |
| Safety Net | 1,895 | 1,900 | 1,751 | 1,460 | 1,360 |
| Grants & Subsidies | 383 | 493 | 550 | 600 | 600 |
| Other | 0 | 0 | 0 | 401 | 0 |
| TOTAL | 3,393 | 3,592 | 3,393 | 3,925 | 3,434 |
 top of page