- Executive Summary
- Preamble & Section 1
- Appropriations Recommendation
- Judiciary
- Independents
- Administration and Finance
- Tech Services and Security
- Energy & Environmental Affairs
- Health and Human Services
- Health & Human Services
- Elder Affairs
- Public Health
- Mental Health
- Refugees and Immigrants
- Youth Services
- Transitional Assistance
- Children and Families
- Mass Commission for the Blind
- Mass Rehabilitation Commission
- Mass Commission for the Deaf
- Soldiers' Home, Chelsea
- Soldiers' Home, Holyoke
- Developmental Services
- Veterans' Services
- Transportation
- Housing & Economic Development
- Labor & Workforce Development
- Education
- Public Safety
- Legislature
- Line Item Summary
- Local Aid to Cities and Towns
- Outside Sections
- Financial Statements
- Operating Transfers
- Tax Expenditure Budget
- Downloads
4000-0300 - EOHHS and Medicaid Administration
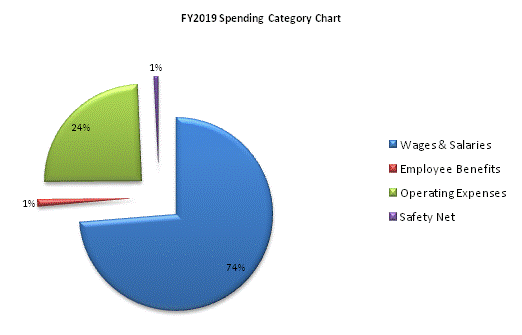
| SPENDING CATEGORY |
FY2015 Expended |
FY2016 Expended |
FY2017 Expended |
FY2018 Projected Spending |
FY2019 House 2 |
|---|---|---|---|---|---|
| Wages & Salaries | 63,059 | 59,245 | 73,347 | 73,549 | 76,218 |
| Employee Benefits | 1,247 | 1,161 | 1,308 | 1,213 | 1,198 |
| Operating Expenses | 22,334 | 21,563 | 19,316 | 23,779 | 25,236 |
| Safety Net | 656 | 686 | 927 | 728 | 728 |
| Grants & Subsidies | 0 | 2,870 | 2,420 | 2,420 | 0 |
| Other | 0 | 0 | 0 | 440 | 0 |
| TOTAL | 87,296 | 85,525 | 97,318 | 102,128 | 103,380 |

 top of page