1790-0100 - Executive Office of Technology Services and Security
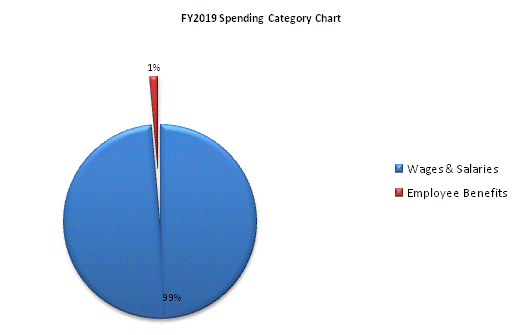
| SPENDING CATEGORY |
FY2015 Expended |
FY2016 Expended |
FY2017 Expended |
FY2018 Projected Spending |
FY2019 House 2 |
|---|---|---|---|---|---|
| Wages & Salaries | 3,213 | 1,878 | 3,111 | 2,881 | 2,882 |
| Employee Benefits | 51 | 32 | 54 | 42 | 40 |
| Operating Expenses | 19 | 16 | 17 | 0 | 0 |
| TOTAL | 3,283 | 1,926 | 3,182 | 2,923 | 2,923 |

 top of page