- Executive Summary
- Preamble & Section 1
- Appropriations Recommendation
- Judiciary
- Independents
- Administration and Finance
- Administration & Finance
- Dev. Disabilities Council
- Capital Asset Management
- Bureau of the State House
- Office on Disability
- Teachers' Retirement Board
- Group Insurance
- Public Employee Retirement
- Administrative Law Appeals
- George Fingold Library
- Dept. of Revenue
- Appellate Tax Board
- Health Policy Commission
- Human Resources Division
- Civil Service Commission
- Operational Services Division
- Tech Services and Security
- Energy & Environmental Affairs
- Health and Human Services
- Transportation
- Housing & Economic Development
- Labor & Workforce Development
- Education
- Public Safety
- Legislature
- Line Item Summary
- Local Aid to Cities and Towns
- Outside Sections
- Financial Statements
- Operating Transfers
- Tax Expenditure Budget
- Downloads
1775-0600 - Surplus Sales Retained Revenue
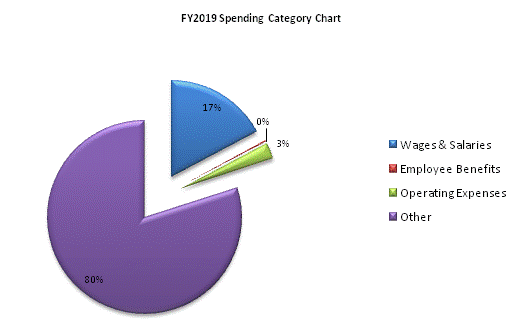
| SPENDING CATEGORY |
FY2015 Expended |
FY2016 Expended |
FY2017 Expended |
FY2018 Projected Spending |
FY2019 House 2 |
|---|---|---|---|---|---|
| Wages & Salaries | 222 | 97 | 96 | 76 | 78 |
| Employee Benefits | 4 | 2 | 2 | 1 | 1 |
| Operating Expenses | 74 | 65 | 5 | 12 | 12 |
| Other | 0 | 191 | 243 | 361 | 361 |
| TOTAL | 300 | 355 | 345 | 450 | 451 |

 top of page