Quick Links
- Executive Summary
- Preamble & Section 1
- Appropriations Recommendations
- Line Item Summary
- Local Aid to Cities and Towns
- Outside Sections
- Financial Statements
- Operating Transfers
- Tax Expenditure Budget
- Downloads
- Related Legislation
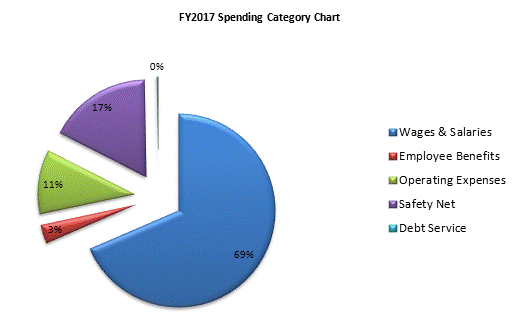
Department of Correction
| SPENDING CATEGORY |
FY2013 Expended |
FY2014 Expended |
FY2015 Expended |
FY2016 Projected Spending * |
FY2017 House 2 |
|---|---|---|---|---|---|
| Wages & Salaries | 371,872 | 392,692 | 403,443 | 400,792 | 407,409 |
| Employee Benefits | 14,418 | 15,679 | 17,659 | 18,549 | 18,567 |
| Operating Expenses | 62,759 | 62,391 | 61,321 | 63,859 | 64,286 |
| Safety Net | 106,954 | 99,885 | 103,428 | 105,800 | 102,458 |
| Grants & Subsidies | 2,050 | 2,548 | 0 | 2,668 | 0 |
| Debt Service | 0 | 731 | 731 | 1,725 | 1,725 |
| TOTAL | 558,054 | 573,927 | 586,584 | 593,393 | 594,445 |

 top of page