Quick Links
Volume 1
Volume 2
- Budget Development
- Financial Statements
- Capital Budget
- Appropriation Recommendations
- Appropriations - Alt. HTML View
- Judiciary
- Independents
- Administration and Finance
- Energy & Environmental Affairs
- Health and Human Services
- Health & Human Services
- Elder Affairs
- Public Health
- Mental Health
- Refugees and Immigrants
- Youth Services
- Transitional Assistance
- Children and Families
- Mass Commission for the Blind
- Mass Rehabilitation Commission
- Mass Commission for the Deaf
- Soldiers' Home, Chelsea
- Soldiers' Home, Holyoke
- Developmental Services
- Veterans' Services
- Transportation
- Housing & Economic Development
- Labor & Workforce Development
- Education
- Public Safety
- Legislature
- Line Item Summary
- Agency Information
- Operating Transfers
- Local Aid - Section 3
- Outside Sections
- Tax Expenditure Budget
- Resources - PDF Files
Department of Elder Affairs
| SPENDING CATEGORY |
FY2011 Expended |
FY2012 Expended |
FY2013 Expended |
FY2014 Projected Spending * |
FY2015 House 2 |
|---|---|---|---|---|---|
| Wages & Salaries | 3,514 | 3,448 | 3,745 | 3,580 | 4,834 |
| Employee Benefits | 81 | 83 | 65 | 68 | 72 |
| Operating Expenses | 449 | 432 | 253 | 424 | 591 |
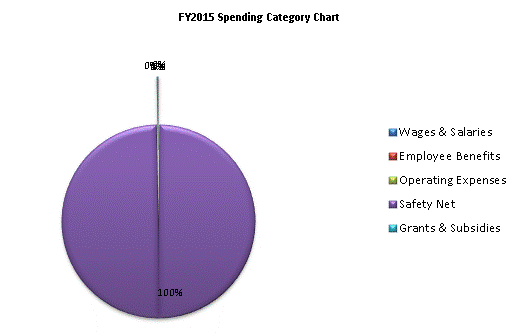
| Safety Net | 2,979,403 | 3,093,626 | 3,192,301 | 3,466,379 | 3,732,135 |
| Grants & Subsidies | 7,904 | 8,207 | 9,384 | 10,725 | 10,635 |
| TOTAL | 2,991,352 | 3,105,796 | 3,205,748 | 3,481,176 | 3,748,266 |
 top of page