Quick Links
- Executive Summary
- Preamble & Section 1
- Appropriations Recommendations
- Judiciary
- Independents
- District Attorneys
- Sheriffs
- Governor's Office
- Secretary of State
- Treasurer
- State Auditor
- Attorney General
- State Ethics Commission
- Inspector General
- Campaign Finance
- Comm. Against Discrimination
- Status of Women
- Disabled Persons Protection
- Library Commissioners
- Comptroller
- Office of the Child Advocate
- Mass Gaming Commission
- Center for Health Info and Analysis
- Administration and Finance
- Energy & Environmental Affairs
- Health and Human Services
- Transportation
- Housing & Economic Development
- Labor & Workforce Development
- Education
- Public Safety
- Legislature
- Line Item Summary
- Local Aid to Cities and Towns
- Outside Sections
- Financial Statements
- Operating Transfers
- Tax Expenditure Budget
- Downloads
- Related Legislation
State Lottery Commission
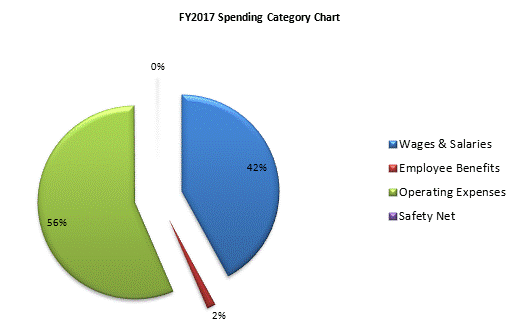
| SPENDING CATEGORY |
FY2013 Expended |
FY2014 Expended |
FY2015 Expended |
FY2016 Projected Spending * |
FY2017 House 2 |
|---|---|---|---|---|---|
| Wages & Salaries | 34,446 | 34,842 | 38,471 | 39,707 | 39,707 |
| Employee Benefits | 1,088 | 1,009 | 1,304 | 1,369 | 1,369 |
| Operating Expenses | 51,431 | 51,808 | 52,614 | 53,132 | 53,132 |
| Safety Net | 76 | 137 | 88 | 109 | 109 |
| TOTAL | 87,040 | 87,796 | 92,477 | 94,317 | 94,317 |
 top of page