House of Representatives
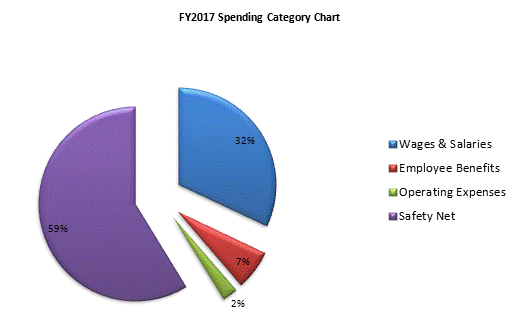
| SPENDING CATEGORY |
FY2013 Expended |
FY2014 Expended |
FY2015 Expended |
FY2016 Projected Spending * |
FY2017 House 2 |
|---|---|---|---|---|---|
| Wages & Salaries | 31,266 | 31,127 | 31,397 | 13,022 | 12,890 |
| Employee Benefits | 891 | 899 | 956 | 2,682 | 2,682 |
| Operating Expenses | 366 | 446 | 434 | 18,274 | 1,037 |
| Safety Net | 0 | 0 | 0 | 24,439 | 23,668 |
| TOTAL | 32,524 | 32,471 | 32,786 | 58,417 | 40,278 |

 top of page