Quick Links
Volume 1
Volume 2
- Financial Statements
- Capital Budget
- Preambles & Sections 1-1C
- Appropriations Recommendations
- Operating Transfers
- Local Aid - Section 3
- Outside Sections Summary
- Tax Expenditure Budget
- Resources - PDF Files
Other Legislation
Department of Housing and Community Development
| SPENDING CATEGORY |
FY2012 Expended |
FY2013 Expended |
FY2014 Expended |
FY2015 Projected Spending * |
FY2016 House 1 |
|---|---|---|---|---|---|
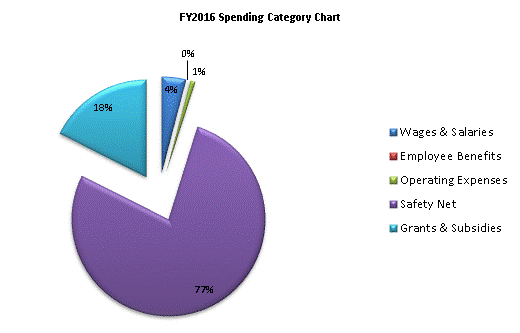
| Wages & Salaries | 12,926 | 14,032 | 16,232 | 15,070 | 15,885 |
| Employee Benefits | 361 | 317 | 379 | 388 | 408 |
| Operating Expenses | 2,657 | 3,039 | 3,093 | 3,258 | 3,220 |
| Safety Net | 301,663 | 309,825 | 349,650 | 338,400 | 313,287 |
| Grants & Subsidies | 67,090 | 69,116 | 70,680 | 70,402 | 71,142 |
| TOTAL | 384,697 | 396,329 | 440,035 | 427,518 | 403,942 |

 top of page