Quick Links
Volume 1
Volume 2
- Financial Statements
- Capital Budget
- Preambles & Sections 1-1C
- Appropriations Recommendations
- Operating Transfers
- Local Aid - Section 3
- Outside Sections Summary
- Tax Expenditure Budget
- Resources - PDF Files
Other Legislation
Independent Agencies and Constitutional Officers
| SPENDING CATEGORY |
FY2012 Expended |
FY2013 Expended |
FY2014 Expended |
FY2015 Projected Spending * |
FY2016 House 1 |
|---|---|---|---|---|---|
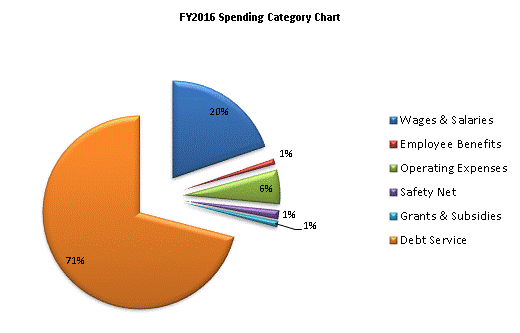
| Wages & Salaries | 579,100 | 599,414 | 630,685 | 682,630 | 665,606 |
| Employee Benefits | 32,244 | 28,566 | 35,101 | 24,672 | 32,372 |
| Operating Expenses | 260,637 | 664,429 | 215,636 | 186,709 | 196,045 |
| Safety Net | 52,463 | 46,989 | 92,409 | 32,263 | 49,527 |
| Grants & Subsidies | 23,662 | 25,643 | 35,188 | 58,349 | 35,590 |
| Debt Service | 2,019,378 | 2,208,692 | 2,225,579 | 2,296,793 | 2,392,399 |
| TOTAL | 2,967,485 | 3,573,733 | 3,234,598 | 3,281,417 | 3,371,539 |

 top of page