Quick Links
Volume 1
Volume 2
- Financial Statements
- Capital Budget
- Preambles & Sections 1-1C
- Appropriations Recommendations
- Operating Transfers
- Local Aid - Section 3
- Outside Sections Summary
- Tax Expenditure Budget
- Resources - PDF Files
Other Legislation
Office of the Secretary of Housing and Economic Development
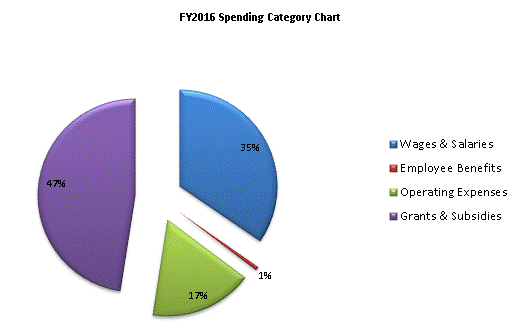
| SPENDING CATEGORY |
FY2012 Expended |
FY2013 Expended |
FY2014 Expended |
FY2015 Projected Spending * |
FY2016 House 1 |
|---|---|---|---|---|---|
| Wages & Salaries | 1,561 | 1,643 | 1,727 | 2,585 | 3,718 |
| Employee Benefits | 34 | 30 | 31 | 53 | 70 |
| Operating Expenses | 915 | 1,530 | 1,685 | 2,100 | 1,850 |
| Grants & Subsidies | 0 | 1,062 | 14,826 | 32,630 | 5,110 |
| TOTAL | 2,510 | 4,266 | 18,269 | 37,368 | 10,748 |

 top of page