Quick Links
Volume 1
Volume 2
- Financial Statements
- Capital Budget
- Preambles & Sections 1-1C
- Appropriations Recommendations
- Judiciary
- Independents
- Administration and Finance
- Energy & Environmental Affairs
- Health and Human Services
- Health & Human Services
- Elder Affairs
- Center for Health Info and Analysis
- Public Health
- Mental Health
- Refugees and Immigrants
- Youth Services
- Transitional Assistance
- Children and Families
- Mass Commission for the Blind
- Mass Rehabilitation Commission
- Mass Commission for the Deaf
- Soldiers' Home, Chelsea
- Soldiers' Home, Holyoke
- Developmental Services
- Veterans' Services
- Transportation
- Housing & Economic Development
- Labor & Workforce Development
- Education
- Public Safety
- Legislature
- Operating Transfers
- Local Aid - Section 3
- Outside Sections Summary
- Tax Expenditure Budget
- Resources - PDF Files
Other Legislation
Massachusetts Commission for the Blind
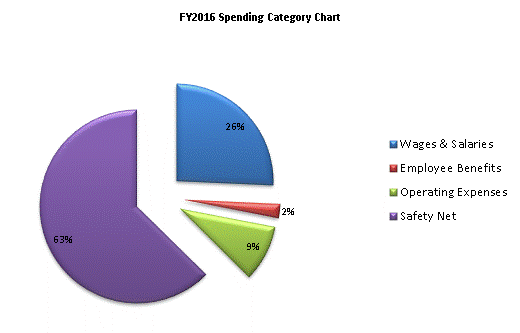
| SPENDING CATEGORY |
FY2012 Expended |
FY2013 Expended |
FY2014 Expended |
FY2015 Projected Spending * |
FY2016 House 1 |
|---|---|---|---|---|---|
| Wages & Salaries | 3,604 | 4,013 | 5,198 | 5,458 | 5,618 |
| Employee Benefits | 512 | 504 | 512 | 505 | 508 |
| Operating Expenses | 2,258 | 1,972 | 1,994 | 2,021 | 2,052 |
| Safety Net | 20,526 | 12,603 | 12,339 | 13,592 | 13,688 |
| TOTAL | 26,899 | 19,093 | 20,043 | 21,577 | 21,866 |

 top of page