Quick Links
Volume 1
Volume 2
- Financial Statements
- Capital Budget
- Preambles & Sections 1-1C
- Appropriations Recommendations
- Judiciary
- Independents
- Administration and Finance
- Energy & Environmental Affairs
- Health and Human Services
- Health & Human Services
- Elder Affairs
- Center for Health Info and Analysis
- Public Health
- Mental Health
- Refugees and Immigrants
- Youth Services
- Transitional Assistance
- Children and Families
- Mass Commission for the Blind
- Mass Rehabilitation Commission
- Mass Commission for the Deaf
- Soldiers' Home, Chelsea
- Soldiers' Home, Holyoke
- Developmental Services
- Veterans' Services
- Transportation
- Housing & Economic Development
- Labor & Workforce Development
- Education
- Public Safety
- Legislature
- Operating Transfers
- Local Aid - Section 3
- Outside Sections Summary
- Tax Expenditure Budget
- Resources - PDF Files
Other Legislation
Department of Developmental Services
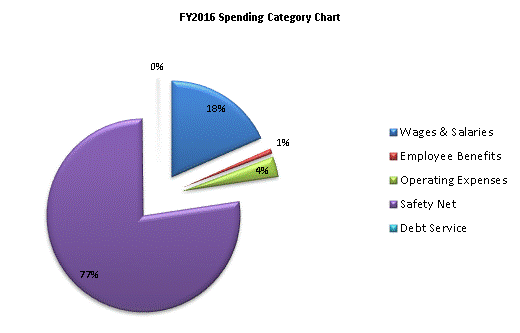
| SPENDING CATEGORY |
FY2012 Expended |
FY2013 Expended |
FY2014 Expended |
FY2015 Projected Spending * |
FY2016 House 1 |
|---|---|---|---|---|---|
| Wages & Salaries | 298,215 | 305,866 | 314,048 | 313,538 | 322,058 |
| Employee Benefits | 14,168 | 12,403 | 13,295 | 14,074 | 14,617 |
| Operating Expenses | 65,453 | 59,996 | 58,373 | 59,034 | 59,675 |
| Safety Net | 944,487 | 981,125 | 1,086,672 | 1,309,395 | 1,351,473 |
| Debt Service | 0 | 0 | 367 | 3,034 | 3,034 |
| TOTAL | 1,322,324 | 1,359,389 | 1,472,756 | 1,699,075 | 1,750,857 |

 top of page