Quick Links
Volume 1
Volume 2
- Financial Statements
- Capital Budget
- Preambles & Sections 1-1C
- Appropriations Recommendations
- Operating Transfers
- Local Aid - Section 3
- Outside Sections Summary
- Tax Expenditure Budget
- Resources - PDF Files
Other Legislation
Office of the Secretary of Education
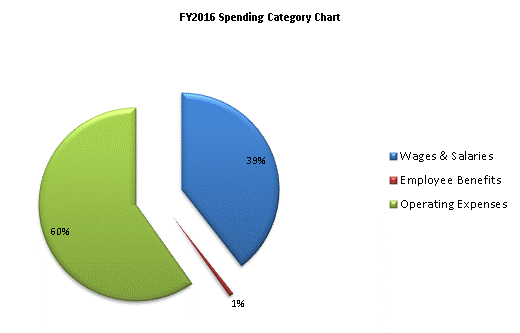
| SPENDING CATEGORY |
FY2012 Expended |
FY2013 Expended |
FY2014 Expended |
FY2015 Projected Spending * |
FY2016 House 1 |
|---|---|---|---|---|---|
| Wages & Salaries | 4,370 | 5,463 | 6,455 | 8,500 | 9,199 |
| Employee Benefits | 97 | 83 | 115 | 161 | 172 |
| Operating Expenses | 4,971 | 6,315 | 10,022 | 10,672 | 13,915 |
| Safety Net | 0 | 0 | 19 | 0 | 0 |
| Grants & Subsidies | 0 | 0 | 0 | 190 | 0 |
| TOTAL | 9,437 | 11,861 | 16,611 | 19,523 | 23,286 |
 top of page