Quick Links
Volume 1
Volume 2
- Financial Statements
- Capital Budget
- Preambles & Sections 1-1C
- Appropriations Recommendations
- Operating Transfers
- Local Aid - Section 3
- Outside Sections Summary
- Tax Expenditure Budget
- Resources - PDF Files
Other Legislation
Department of Elementary and Secondary Education
| SPENDING CATEGORY |
FY2012 Expended |
FY2013 Expended |
FY2014 Expended |
FY2015 Projected Spending * |
FY2016 House 1 |
|---|---|---|---|---|---|
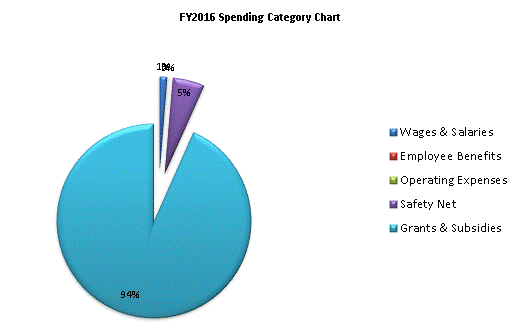
| Wages & Salaries | 46,966 | 52,836 | 55,766 | 61,542 | 61,442 |
| Employee Benefits | 473 | 416 | 454 | 533 | 555 |
| Operating Expenses | 5,532 | 5,599 | 6,185 | 6,255 | 6,192 |
| Safety Net | 229,015 | 255,546 | 264,355 | 268,112 | 268,041 |
| Grants & Subsidies | 4,202,435 | 4,416,975 | 4,576,061 | 4,636,865 | 4,718,682 |
| TOTAL | 4,484,421 | 4,731,372 | 4,902,821 | 4,973,308 | 5,054,912 |

 top of page