Quick Links
Volume 1
Volume 2
- Financial Statements
- Capital Budget
- Preambles & Sections 1-1C
- Appropriations Recommendations
- Judiciary
- Independents
- Administration and Finance
- Administration & Finance
- Dev. Disabilities Council
- Capital Asset Management
- Bureau of the State House
- Office on Disability
- Teachers' Retirement Board
- Group Insurance
- Public Employee Retirement
- Administrative Law Appeals
- George Fingold Library
- Dept. of Revenue
- Appellate Tax Board
- Health Policy Commission
- Human Resources Division
- Civil Service Commission
- Operational Services Division
- Information Technology
- Energy & Environmental Affairs
- Health and Human Services
- Transportation
- Housing & Economic Development
- Labor & Workforce Development
- Education
- Public Safety
- Legislature
- Operating Transfers
- Local Aid - Section 3
- Outside Sections Summary
- Tax Expenditure Budget
- Resources - PDF Files
Other Legislation
Bureau of the State House
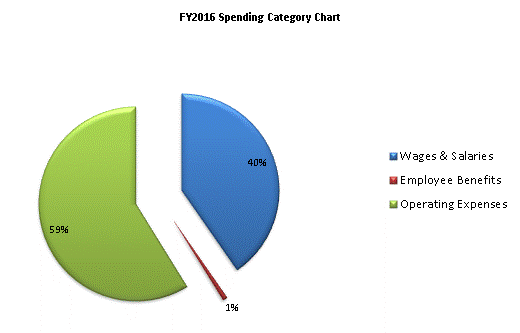
| SPENDING CATEGORY |
FY2012 Expended |
FY2013 Expended |
FY2014 Expended |
FY2015 Projected Spending * |
FY2016 House 1 |
|---|---|---|---|---|---|
| Wages & Salaries | 1,632 | 799 | 834 | 986 | 940 |
| Employee Benefits | 159 | 11 | 12 | 20 | 19 |
| Operating Expenses | 10,045 | 1,070 | 1,434 | 1,322 | 1,369 |
| TOTAL | 11,836 | 1,880 | 2,280 | 2,328 | 2,328 |

 top of page