Quick Links
Volume 1
Volume 2
- Financial Statements
- Capital Budget
- Preambles & Sections 1-1C
- Appropriations Recommendations
- Judiciary
- Independents
- Administration and Finance
- Administration & Finance
- Dev. Disabilities Council
- Capital Asset Management
- Bureau of the State House
- Office on Disability
- Teachers' Retirement Board
- Group Insurance
- Public Employee Retirement
- Administrative Law Appeals
- George Fingold Library
- Dept. of Revenue
- Appellate Tax Board
- Health Policy Commission
- Human Resources Division
- Civil Service Commission
- Operational Services Division
- Information Technology
- Energy & Environmental Affairs
- Health and Human Services
- Transportation
- Housing & Economic Development
- Labor & Workforce Development
- Education
- Public Safety
- Legislature
- Operating Transfers
- Local Aid - Section 3
- Outside Sections Summary
- Tax Expenditure Budget
- Resources - PDF Files
Other Legislation
Office of the Secretary for Administration and Finance
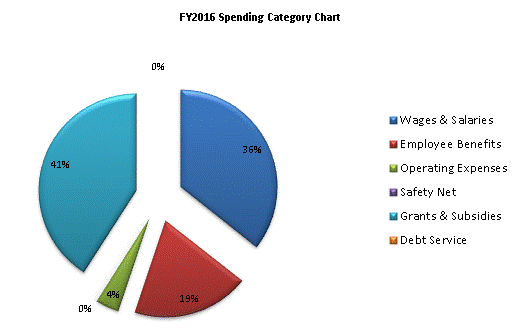
| SPENDING CATEGORY |
FY2012 Expended |
FY2013 Expended |
FY2014 Expended |
FY2015 Projected Spending * |
FY2016 House 1 |
|---|---|---|---|---|---|
| Wages & Salaries | 27,097 | 87,031 | 35,474 | 42,776 | 121,894 |
| Employee Benefits | 8,203 | 384 | 477 | 478 | 66,466 |
| Operating Expenses | 9,237 | 15,341 | 15,970 | 27,193 | 13,116 |
| Safety Net | 615,010 | 662,125 | 340,558 | 6,869 | 296 |
| Grants & Subsidies | 162,132 | 148,119 | 140,847 | 143,039 | 140,000 |
| Debt Service | 380 | 192 | 87 | 32 | 34 |
| TOTAL | 822,059 | 913,192 | 533,412 | 220,387 | 341,805 |

 top of page