Quick Links
Volume 1
Volume 2
- Budget Development
- Financial Statements
- Capital Budget
- Appropriation Recommendations
- Appropriations - Alt. HTML View
- Agency Information
- Operating Transfers
- Local Aid - Section 3
- Outside Sections
- Tax Expenditure Budget
- Resources - PDF Files
Executive Office of Housing and Economic Development
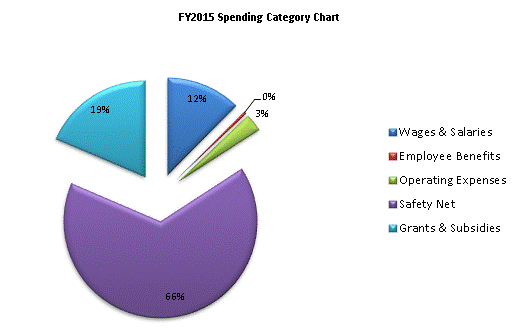
| SPENDING CATEGORY |
FY2011 Expended |
FY2012 Expended |
FY2013 Expended |
FY2014 Projected Spending * |
FY2015 House 2 |
|---|---|---|---|---|---|
| Wages & Salaries | 42,445 | 42,256 | 46,293 | 58,476 | 59,390 |
| Employee Benefits | 1,992 | 2,067 | 1,869 | 2,137 | 2,208 |
| Operating Expenses | 10,935 | 11,391 | 12,213 | 14,215 | 14,466 |
| Safety Net | 233,880 | 301,663 | 309,825 | 318,664 | 314,832 |
| Grants & Subsidies | 77,079 | 80,705 | 89,308 | 134,040 | 89,107 |
| TOTAL | 366,331 | 438,082 | 459,508 | 527,532 | 480,002 |

 top of page