Quick Links
Volume 1
Volume 2
- Budget Development
- Financial Statements
- Capital Budget
- Appropriation Recommendations
- Appropriations - Alt. HTML View
- Judiciary
- Independents
- Administration and Finance
- Administration & Finance
- Dev. Disabilities Council
- Capital Asset Management
- Bureau of the State House
- Office on Disability
- Teachers' Retirement Board
- Group Insurance
- Public Employee Retirement
- Administrative Law Appeals
- George Fingold Library
- Dept. of Revenue
- Appellate Tax Board
- Health Policy Commission
- Human Resources Division
- Civil Service Commission
- Operational Services Division
- Information Technology
- Energy & Environmental Affairs
- Health and Human Services
- Transportation
- Housing & Economic Development
- Labor & Workforce Development
- Education
- Public Safety
- Legislature
- Line Item Summary
- Agency Information
- Operating Transfers
- Local Aid - Section 3
- Outside Sections
- Tax Expenditure Budget
- Resources - PDF Files
Department of Revenue
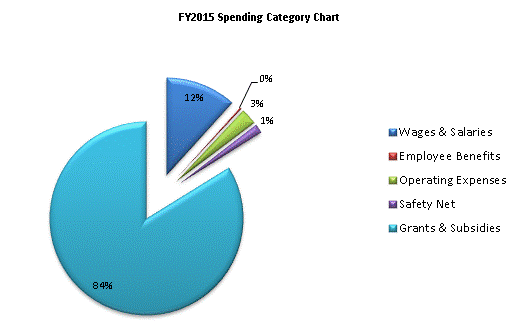
| SPENDING CATEGORY |
FY2011 Expended |
FY2012 Expended |
FY2013 Expended |
FY2014 Projected Spending * |
FY2015 House 2 |
|---|---|---|---|---|---|
| Wages & Salaries | 122,018 | 122,143 | 127,712 | 131,804 | 135,372 |
| Employee Benefits | 3,604 | 3,617 | 2,975 | 3,210 | 3,262 |
| Operating Expenses | 22,497 | 20,415 | 25,887 | 28,419 | 31,491 |
| Safety Net | 23,999 | 18,200 | 26,300 | 12,254 | 17,500 |
| Grants & Subsidies | 950,168 | 950,472 | 950,041 | 972,538 | 971,038 |
| TOTAL | 1,122,287 | 1,114,847 | 1,132,915 | 1,148,225 | 1,158,664 |

 top of page