Quick Links
Volume 1
Volume 2
- Budget Development
- Financial Statements
- Capital Budget
- Appropriation Recommendations
- Appropriations - Alt. HTML View
- Judiciary
- Independents
- Administration and Finance
- Administration & Finance
- Dev. Disabilities Council
- Capital Asset Management
- Bureau of the State House
- Office on Disability
- Teachers' Retirement Board
- Group Insurance
- Public Employee Retirement
- Administrative Law Appeals
- George Fingold Library
- Dept. of Revenue
- Appellate Tax Board
- Health Policy Commission
- Human Resources Division
- Civil Service Commission
- Operational Services Division
- Information Technology
- Energy & Environmental Affairs
- Health and Human Services
- Transportation
- Housing & Economic Development
- Labor & Workforce Development
- Education
- Public Safety
- Legislature
- Line Item Summary
- Agency Information
- Operating Transfers
- Local Aid - Section 3
- Outside Sections
- Tax Expenditure Budget
- Resources - PDF Files
Office of the Secretary for Administration and Finance
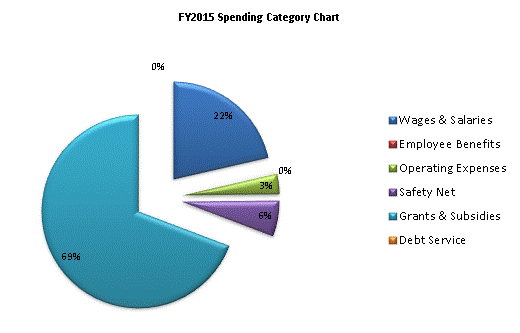
| SPENDING CATEGORY |
FY2011 Expended |
FY2012 Expended |
FY2013 Expended |
FY2014 Projected Spending * |
FY2015 House 2 |
|---|---|---|---|---|---|
| Wages & Salaries | 77,052 | 27,360 | 87,420 | 63,082 | 91,754 |
| Employee Benefits | 18,125 | 8,209 | 394 | 366 | 412 |
| Operating Expenses | 560,428 | 9,293 | 15,341 | 21,315 | 14,046 |
| Safety Net | 186,940 | 615,010 | 662,125 | 405,778 | 25,417 |
| Grants & Subsidies | 140,806 | 162,132 | 148,119 | 218,060 | 296,147 |
| Debt Service | 382 | 380 | 192 | 87 | 87 |
| TOTAL | 983,733 | 822,384 | 913,591 | 708,689 | 427,863 |

 top of page