- Statewide Summary
- Judiciary
- Independents
- District Attorneys
- Sheriffs
- Governor's Office
- Secretary of State
- Treasurer
- State Auditor
- Attorney General
- State Ethics Commission
- Inspector General
- Campaign Finance
- Comm. Against Discrimination
- Status of Women
- Disabled Persons Protection
- Library Commissioners
- Comptroller
- Office of the Child Advocate
- Cannabis Control Commission
- Mass Gaming Commission
- Center for Health Info and Analysis
- Administration and Finance
- Tech Services and Security
- Energy & Environmental Affairs
- Health and Human Services
- Transportation
- Housing & Economic Development
- Labor & Workforce Development
- Education
- Public Safety
- Legislature
- All Account Listing
- Veto Listing
- Local Aid - Section 3
- Outside Sections
- Downloads
- Budget Glossary
- Helpful Links
Office of the Attorney General
Data Current as of: 8/10/2018
| SPENDING CATEGORY |
FY2015 Expended |
FY2016 Expended |
FY2017 Expended |
FY2018 Projected |
FY2019 GAA |
|---|---|---|---|---|---|
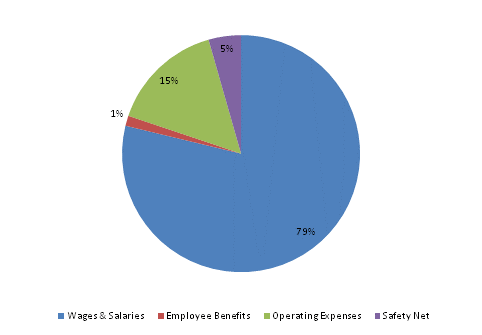
| Wages & Salaries | 31,221 | 32,312 | 34,659 | 36,131 | 39,633 |
| Employee Benefits | 648 | 719 | 725 | 686 | 692 |
| Operating Expenses | 6,804 | 7,265 | 6,847 | 7,812 | 7,757 |
| Safety Net | 2,188 | 2,149 | 2,128 | 2,128 | 2,228 |
| TOTAL | 40,861 | 42,445 | 44,358 | 46,757 | 50,310 |
FY2019 Spending Category Chart

 top of page