- Statewide Summary
- Judiciary
- Independents
- Administration and Finance
- Tech Services and Security
- Energy & Environmental Affairs
- Health and Human Services
- Health & Human Services
- Elder Affairs
- Public Health
- Mental Health
- Refugees and Immigrants
- Youth Services
- Transitional Assistance
- Children and Families
- Mass Commission for the Blind
- Mass Rehabilitation Commission
- Mass Commission for the Deaf
- Soldiers' Home, Chelsea
- Soldiers' Home, Holyoke
- Developmental Services
- Veterans' Services
- Transportation
- Housing & Economic Development
- Labor & Workforce Development
- Education
- Public Safety
- Legislature
- All Account Listing
- Veto Listing
- Local Aid - Section 3
- Outside Sections
- Downloads
- Budget Glossary
- Helpful Links
Executive Office of Health and Human Services
Data Current as of: 8/10/2018
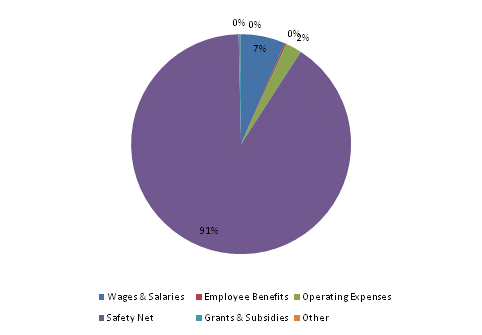
| SPENDING CATEGORY |
FY2015 Expended |
FY2016 Expended |
FY2017 Expended |
FY2018 Projected |
FY2019 GAA |
|---|---|---|---|---|---|
| Wages & Salaries | 1,271,412 | 1,273,417 | 1,368,717 | 1,432,749 | 1,468,795 |
| Employee Benefits | 52,040 | 56,584 | 59,905 | 63,604 | 59,651 |
| Operating Expenses | 409,764 | 435,154 | 427,723 | 514,875 | 535,988 |
| Safety Net | 17,252,150 | 18,512,758 | 19,014,003 | 19,769,042 | 20,448,348 |
| Grants & Subsidies | 36,132 | 64,357 | 51,385 | 47,045 | 73,517 |
| Other | 1,892 | 1,892 | 1,892 | 16,091 | 6,145 |
| TOTAL | 19,023,390 | 20,344,162 | 20,923,625 | 21,843,407 | 22,592,445 |
FY2019 Spending Category Chart
 top of page