Quick Links
- Report
- Introduction
- Accomplishments & Initiatives
- American Recovery and Reinvestment Act of 2009
- Development of the FY13-17 Capital Investment Plan
- Affordability & Fiscal Responsibility
- Impact of Capital Budget on the Operating Budget
- Aggregate FY13-17 Capital Investment Plan
- Capital Investments by Investment Category
- Appendix A - Debt Affordability Analysis
- Appendix B - Bond Bills
- Appendix C - Project Listing (pdf)
- Appendix D - Project Descriptions (pdf)
- Plan by Investment
- Plan by Capital Agency
- Plan by Beneficiary Agency
- Downloads
Aggregate FY13-17 Capital Investment Plan
The full five-year capital investment plan by major investment categories is presented below. All specific projects and programs expected to be funded in FY13 are identified in Appendix C, and descriptions of all of these projects and programs are included in Appendix D. It should be noted that many of the projects funded in FY13 are multi-year projects with costs that will be incurred in subsequent fiscal years; these projected future costs have been taken into account in making investment category reservations for future years. It is also important to note that projects will evolve and change, and A&F intends to adjust the capital investment plan during the fiscal year as circumstances dictate. Each new fiscal year, A&F will also undertake a formal reassessment of capital investment needs to develop an annual update to the five-year capital investment plan.
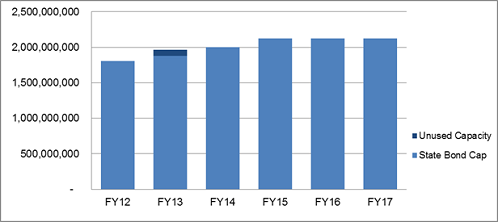
Total Bond Cap by Year and by Major Investment Category
The following table and chart show the allocation of bond cap spending by year and then by major investment category. Note that FY13 includes $93 million in unused capacity from the prior fiscal year. The Administration has conservatively constrained the bond cap in FY16 and FY17 at the FY15 level. Future debt affordability analysis may show sufficient revenue growth to allow increased bond cap in future plans.
FY13-17 Capital Investment Plan - Total Bond Cap
| (In thousands) | |||||||
| FY13 | FY14 | FY15 | FY16 | FY17 | Five Year Total | % of 5-Year Total |
|
|---|---|---|---|---|---|---|---|
| Community Investments | 291,743 | 285,456 | 277,117 | 273,286 | 273,212 | 1,400,813 | 14% |
| Corrections | 37,384 | 55,350 | 56,500 | 63,500 | 76,500 | 289,234 | 3% |
| Courts | 20,170 | 75,874 | 127,674 | 147,674 | 114,168 | 485,558 | 5% |
| Economic Development | 138,240 | 128,920 | 138,500 | 150,000 | 148,000 | 703,659 | 7% |
| Energy And Environment | 167,141 | 159,329 | 114,179 | 86,346 | 87,346 | 614,340 | 6% |
| Health And Human Services | 27,582 | 37,615 | 69,575 | 75,400 | 102,000 | 312,172 | 3% |
| Higher Education | 177,420 | 259,928 | 293,172 | 287,700 | 281,900 | 1,300,121 | 13% |
| Housing | 179,500 | 169,500 | 169,500 | 169,500 | 169,500 | 857,500 | 8% |
| Information Technology | 174,380 | 101,973 | 118,822 | 120,897 | 119,614 | 635,685 | 6% |
| Public Safety | 28,083 | 37,530 | 66,780 | 66,930 | 51,180 | 250,503 | 2% |
| State Office Buildings | 73,553 | 64,103 | 72,835 | 58,951 | 68,056 | 337,497 | 3% |
| Transportation | 652,959 | 624,423 | 620,348 | 624,817 | 633,525 | 3,156,072 | 31% |
| Total Bond Cap | 1,968,155 | 2,000,000 | 2,125,000 | 2,125,000 | 2,125,000 | 10,343,155 | |
Total Capital Spending by Year and by Major Investment Category
The following table shows the allocation of total capital spending from all sources by year and source and then by major investment category. A description of the sources of funding follows.
FY13-17 Capital Investment Plan - Total All Sources

| (In thousands) | |||||||
| FY13 | FY14 | FY15 | FY16 | FY17 | Five Year Total | % of 5-Year Total |
|
|---|---|---|---|---|---|---|---|
| Community Investments | 322,719 | 314,847 | 304,517 | 300,286 | 300,612 | 1,542,980 | 9% |
| Corrections | 37,384 | 55,350 | 56,500 | 63,500 | 76,500 | 289,234 | 2% |
| Courts | 20,170 | 75,874 | 132,674 | 162,674 | 119,168 | 510,558 | 3% |
| Economic Development | 188,153 | 153,920 | 163,500 | 175,000 | 173,000 | 853,573 | 5% |
| Energy And Environment | 266,791 | 287,279 | 221,129 | 143,296 | 132,546 | 1,051,040 | 6% |
| Health And Human Services | 30,982 | 40,000 | 88,600 | 103,600 | 106,000 | 369,182 | 2% |
| Higher Education | 247,720 | 326,071 | 309,872 | 290,700 | 285,400 | 1,459,763 | 9% |
| Housing | 179,500 | 169,500 | 169,500 | 169,500 | 169,500 | 857,500 | 5% |
| Information Technology | 236,744 | 210,945 | 177,923 | 177,040 | 139,811 | 942,462 | 6% |
| Public Safety | 39,923 | 51,730 | 72,577 | 66,930 | 51,180 | 282,340 | 2% |
| State Office Buildings | 73,553 | 64,103 | 72,835 | 58,951 | 68,056 | 337,497 | 2% |
| Transportation | 1,630,874 | 1,776,138 | 1,686,300 | 1,647,732 | 1,430,563 | 8,171,607 | 49% |
| Total Bond Cap | 3,274,513 | 3,525,755 | 3,455,925 | 3,359,209 | 3,052,335 | 16,667,737 | |
Description of Sources of Funds
- State Bond Cap – Commonwealth borrowing to support the regular capital program.
- Federal Funds – Federal reimbursements for capital expenditures.
- Other Funds – Contributions made by third-parties to capital projects being carried out by the Commonwealth.
- Project Financed – Self-supporting bonds payable by the Commonwealth from a new stream of project revenue, including the CEIP program where Commonwealth bonds are payable with savings to be achieved as a result of energy efficiencies.
- Pay-As-You-Go – Funding from current revenue for capital projects. In Appendix C, this Pay-As-You-Go is shown in the other funds category.
- Accelerated Bridge Program (ABP) – Commonwealth special obligation bonds secured by revenues credited to the Commonwealth Transportation Fund or federal grant anticipation notes issued to fund the Accelerated Bridge Program. In Appendix C, this ABP is shown in the other funds category.
 top of page