Quick Links
Volume 1
Volume 2
- Financial Statements
- Capital Budget
- Preambles & Sections 1-1C
- Appropriations Recommendations
- Judiciary
- Independents
- Administration and Finance
- Energy & Environmental Affairs
- Health and Human Services
- Transportation
- Housing & Economic Development
- Labor & Workforce Development
- Education
- Public Safety
- Legislature
- Operating Transfers
- Local Aid - Section 3
- Outside Sections Summary
- Tax Expenditure Budget
- Resources - PDF Files
Other Legislation
State Lottery Commission
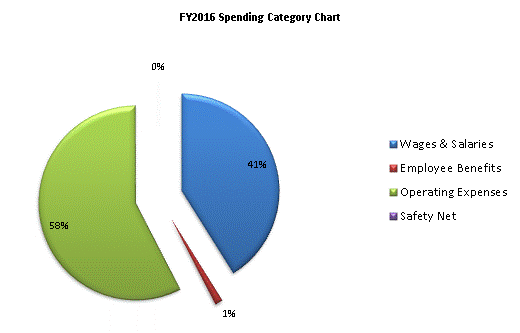
| SPENDING CATEGORY |
FY2012 Expended |
FY2013 Expended |
FY2014 Expended |
FY2015 Projected Spending * |
FY2016 House 1 |
|---|---|---|---|---|---|
| Wages & Salaries | 29,574 | 34,446 | 34,842 | 38,181 | 38,181 |
| Employee Benefits | 1,361 | 1,088 | 1,009 | 1,207 | 1,207 |
| Operating Expenses | 51,277 | 51,431 | 51,808 | 53,429 | 53,429 |
| Safety Net | 48 | 76 | 137 | 44 | 44 |
| Grants & Subsidies | 200 | 0 | 0 | 0 | 0 |
| TOTAL | 82,460 | 87,040 | 87,796 | 92,861 | 92,861 |
 top of page