Quick Links
Volume 1
Volume 2
- Financial Statements
- Capital Budget
- Preambles & Sections 1-1C
- Appropriations Recommendations
- Operating Transfers
- Local Aid - Section 3
- Outside Sections Summary
- Tax Expenditure Budget
- Resources - PDF Files
Other Legislation
Department of Labor Standards
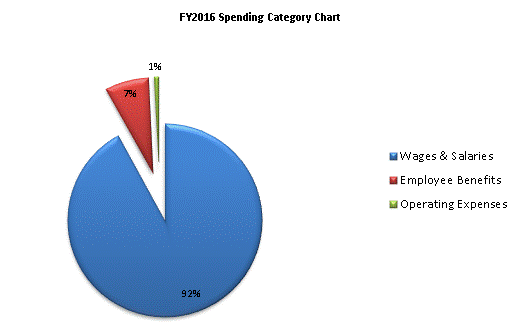
| SPENDING CATEGORY |
FY2012 Expended |
FY2013 Expended |
FY2014 Expended |
FY2015 Projected Spending * |
FY2016 House 1 |
|---|---|---|---|---|---|
| Wages & Salaries | 1,973 | 2,149 | 2,135 | 2,463 | 2,900 |
| Employee Benefits | 83 | 64 | 92 | 49 | 227 |
| Operating Expenses | 291 | 240 | 256 | 0 | 23 |
| TOTAL | 2,347 | 2,453 | 2,483 | 2,512 | 3,150 |
 top of page