Quick Links
Volume 1
Volume 2
- Financial Statements
- Capital Budget
- Preambles & Sections 1-1C
- Appropriations Recommendations
- Operating Transfers
- Local Aid - Section 3
- Outside Sections Summary
- Tax Expenditure Budget
- Resources - PDF Files
Other Legislation
Committee for Public Counsel Services
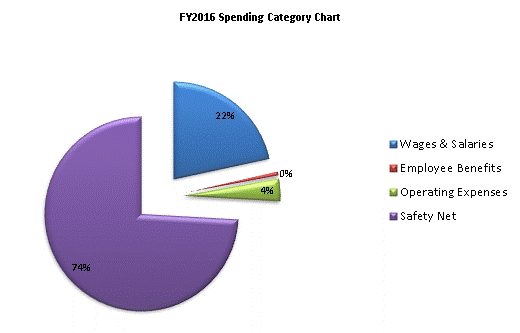
| SPENDING CATEGORY |
FY2012 Expended |
FY2013 Expended |
FY2014 Expended |
FY2015 Projected Spending * |
FY2016 House 1 |
|---|---|---|---|---|---|
| Wages & Salaries | 32,844 | 40,426 | 41,536 | 44,241 | 43,605 |
| Employee Benefits | 1,134 | 1,177 | 1,181 | 1,183 | 1,183 |
| Operating Expenses | 6,924 | 9,348 | 9,173 | 7,415 | 7,415 |
| Safety Net | 150,659 | 152,967 | 149,930 | 149,451 | 149,451 |
| TOTAL | 191,561 | 203,918 | 201,820 | 202,289 | 201,653 |
 top of page