Quick Links
Volume 1
Volume 2
- Budget Development
- Financial Statements
- Capital Budget
- Appropriation Recommendations
- Appropriations - Alt. HTML View
- Judiciary
- Independents
- Administration and Finance
- Energy & Environmental Affairs
- Health and Human Services
- Health & Human Services
- Elder Affairs
- Public Health
- Mental Health
- Refugees and Immigrants
- Youth Services
- Transitional Assistance
- Children and Families
- Mass Commission for the Blind
- Mass Rehabilitation Commission
- Mass Commission for the Deaf
- Soldiers' Home, Chelsea
- Soldiers' Home, Holyoke
- Developmental Services
- Veterans' Services
- Transportation
- Housing & Economic Development
- Labor & Workforce Development
- Education
- Public Safety
- Legislature
- Line Item Summary
- Agency Information
- Operating Transfers
- Local Aid - Section 3
- Outside Sections
- Tax Expenditure Budget
- Resources - PDF Files
Executive Office of Health and Human Services
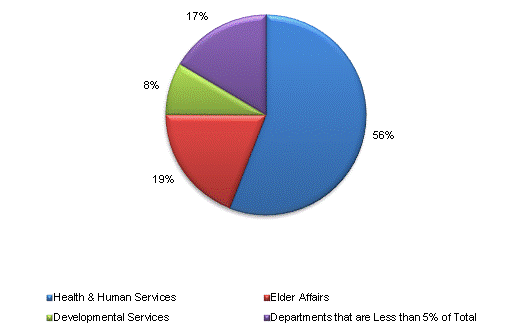
| DEPARTMENT | FY 2015 Budgetary Recommendations |
FY 2015 Federal, Trust, and ISF |
FY 2015 Total Spending |
FY 2015 Budgetary Non-Tax Revenue |
|---|---|---|---|---|
| Office of the Secretary of Health and Human Services | 10,929,771 | 734,702 | 11,664,473 | 6,849,736 |
| Department of Elder Affairs | 3,748,266 | 34,299 | 3,782,565 | 1,778,931 |
| Department of Public Health | 565,535 | 379,914 | 945,449 | 245,513 |
| Department of Mental Health | 712,360 | 22,726 | 735,086 | 101,848 |
| Office for Refugees and Immigrants | 341 | 17,396 | 17,737 | 0 |
| Department of Youth Services | 176,550 | 447 | 176,997 | 3,682 |
| Department of Transitional Assistance | 737,055 | 4,318 | 741,374 | 458,488 |
| Department of Children and Families | 818,985 | 15,550 | 834,534 | 206,527 |
| Massachusetts Commission for the Blind | 21,825 | 11,030 | 32,855 | 3,085 |
| Massachusetts Rehabilitation Commission | 48,717 | 101,868 | 150,585 | 3,694 |
| Massachusetts Commission for the Deaf and Hard of Hearing | 5,823 | 250 | 6,073 | 194 |
| Soldiers' Home in Massachusetts | 28,323 | 0 | 28,323 | 15,116 |
| Soldiers' Home in Holyoke | 22,465 | 0 | 22,465 | 16,506 |
| Department of Developmental Services | 1,652,606 | 12,141 | 1,664,747 | 589,123 |
| Department of Veterans' Services | 86,727 | 2,100 | 88,827 | 580 |
| TOTAL | 19,555,348 | 1,336,741 | 20,892,090 | 10,273,023 |
 top of page