- Statewide Summary
- Judiciary
- Independents
- Administration and Finance
- Administration & Finance
- Dev. Disabilities Council
- Capital Asset Management
- Bureau of the State House
- Office on Disability
- Teachers' Retirement Board
- Group Insurance
- Public Employee Retirement
- Administrative Law Appeals
- George Fingold Library
- Dept. of Revenue
- Appellate Tax Board
- Health Policy Commission
- Human Resources Division
- Civil Service Commission
- Operational Services Division
- Tech Services and Security
- Energy & Environmental Affairs
- Health and Human Services
- Transportation
- Housing & Economic Development
- Labor & Workforce Development
- Education
- Public Safety
- Legislature
- All Account Listing
- Veto Listing
- Local Aid - Section 3
- Outside Sections
- Downloads
- Budget Glossary
- Helpful Links
Office of the Secretary of Administration and Finance
Data Current as of: 8/10/2018
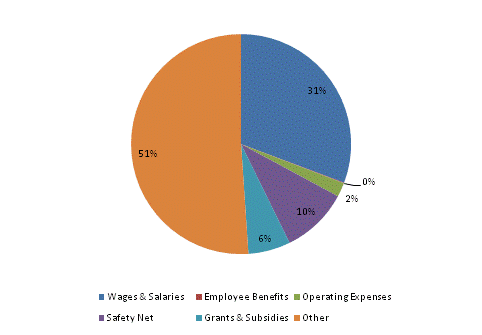
| SPENDING CATEGORY |
FY2015 Expended |
FY2016 Expended |
FY2017 Expended |
FY2018 Projected |
FY2019 GAA |
|---|---|---|---|---|---|
| Wages & Salaries | 31,318 | 26,413 | 33,699 | 66,366 | 121,451 |
| Employee Benefits | 529 | 29,596 | 713 | 379 | 325 |
| Operating Expenses | 21,645 | 14,455 | 13,314 | 11,223 | 8,201 |
| Safety Net | 547 | 21,021 | 9,926 | 17,881 | 39,040 |
| Grants & Subsidies | 139,951 | 145,200 | 142,376 | 156,495 | 24,550 |
| Other | 61,851 | 57,412 | 51,201 | 87,912 | 201,993 |
| TOTAL | 255,840 | 294,099 | 251,229 | 340,256 | 395,560 |
FY2019 Spending Category Chart
 top of page