| SPENDING CATEGORY |
FY2015 Expended |
FY2016 Expended |
FY2017 Expended |
FY2018 Projected |
FY2019 GAA |
|---|---|---|---|---|---|
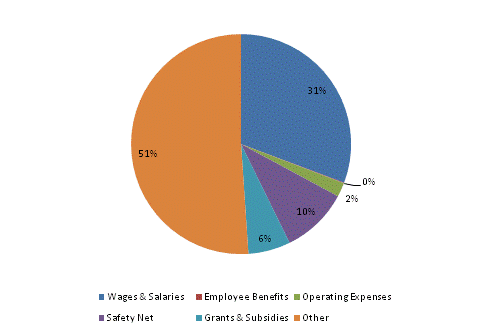
| Wages & Salaries | 31,318 | 26,413 | 33,699 | 66,366 | 121,451 |
| Employee Benefits | 529 | 29,596 | 713 | 379 | 325 |
| Operating Expenses | 21,645 | 14,455 | 13,314 | 11,223 | 8,201 |
| Safety Net | 547 | 21,021 | 9,926 | 17,881 | 39,040 |
| Grants & Subsidies | 139,951 | 145,200 | 142,376 | 156,495 | 24,550 |
| Other | 61,851 | 57,412 | 51,201 | 87,912 | 201,993 |
| TOTAL | 255,840 | 294,099 | 251,229 | 340,256 | 395,560 |
FY2019 Spending Category Chart
