Budget Summary FY2019

This is not the official budget document.

    SEARCH
    • Statewide Summary
      • Judiciary
      • Independents
      • Administration and Finance
      • Tech Services and Security
      • Energy & Environmental Affairs
      • Health and Human Services
      • Transportation
      • Housing & Economic Development
      • Labor & Workforce Development
      • Education
      • Public Safety
        • Public Safety & Security
        • Chief Medical Examiner
        • Criminal Justice Info Services
        • Sex Offender Registry
        • State Police
        • Municipal Training
        • Fire Services
        • Military Division
        • Emergency Management
        • Dept. of Correction
        • Parole Board
      • Legislature
    • All Account Listing
    • Veto Listing
    • Local Aid - Section 3
    • Outside Sections
    • Downloads
    • Budget Glossary
    • Helpful Links

    printer friendly

    Home > Public Safety > Dept. of Correction > 8900-0001 - Budget Build-Up

    Budget Detail
    8900-0001 - Department of Correction Facility Operations
    Data Current as of:  8/10/2018


    • Account
      Language
    • Account
      Detail


    FY2019
    House 1

    FY2019
    House Final

    FY2019
    Senate Final

    FY2019
    GAA
    Budget Tracking 630,776,442 632,372,710 627,379,903 633,197,710

      FY2016
    GAA
    FY2017
    GAA
    FY2018
    GAA
    FY2018
    Projected
    FY2019
    GAA
    Historical Budget Levels 567,483,603 568,707,345 615,454,903 619,904,903 633,197,710

    * GAA is General Appropriation Act.


    HISTORICAL SPENDING CATEGORIES ($000)
    SPENDING CATEGORY
    FY2015
    Expended

    FY2016
    Expended

    FY2017
    Expended

    FY2018
    Projected

    FY2019
    GAA
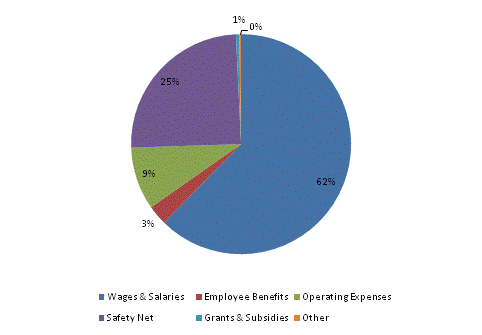
    Wages & Salaries 386,603 384,676 392,772 392,798 394,760
    Employee Benefits 17,304 17,867 18,388 18,671 18,513
    Operating Expenses 58,401 57,153 52,854 58,637 58,463
    Safety Net 103,182 102,449 123,289 145,524 156,702
    Grants & Subsidies 0 2,668 2,200 2,290 3,050
    Other 731 1,725 1,725 1,985 1,710
    TOTAL 566,221 566,539 591,228 619,905 633,198


    FY2019 Spending Category Chart

    Pie Chart: Wages & Salaries=63%, Employee Benefits=3%, Operating Expenses=9%, Safety Net=25%, Grants & Subsidies=0%, Other=0%


    top of page link top of page

      Related Links

    • Office of the Governor
    • Executive Office for Administration and Finance

      About

    • Site Policies
    • Contact Us
    Massachusetts State Seal

    © 2018 Commonwealth of Massachusetts.

    Mass.Gov® is a registered service mark of the Commonwealth of Massachusetts.