Quick Links
- Statewide Summary
- Judiciary
- Independents
- Administration and Finance
- Tech Services and Security
- Energy & Environmental Affairs
- Health and Human Services
- Health & Human Services
- Elder Affairs
- Public Health
- Mental Health
- Refugees and Immigrants
- Youth Services
- Transitional Assistance
- Children and Families
- Mass Commission for the Blind
- Mass Rehabilitation Commission
- Mass Commission for the Deaf
- Soldiers' Home, Chelsea
- Soldiers' Home, Holyoke
- Developmental Services
- Veterans' Services
- Transportation
- Housing & Economic Development
- Labor & Workforce Development
- Education
- Public Safety
- Legislature
- All Account Listing
- Veto Listing
- Local Aid - Section 3
- Outside Sections
- Downloads
- Budget Glossary
- Helpful Links
| SPENDING CATEGORY |
FY2014 Expended |
FY2015 Expended |
FY2016 Expended |
FY2017 Projected |
FY2018 GAA |
|---|---|---|---|---|---|
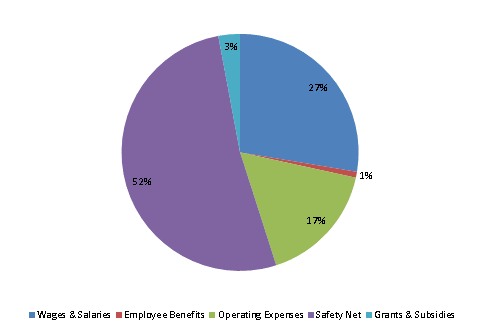
| Wages & Salaries | 159,369 | 166,994 | 158,064 | 162,163 | 168,283 |
| Employee Benefits | 4,374 | 4,663 | 4,724 | 4,886 | 4,857 |
| Operating Expenses | 128,527 | 88,770 | 84,503 | 83,505 | 101,389 |
| Safety Net | 237,410 | 239,450 | 260,293 | 296,938 | 316,551 |
| Grants & Subsidies | 16,912 | 16,719 | 17,875 | 14,728 | 17,948 |
| TOTAL | 546,593 | 516,596 | 525,459 | 562,220 | 609,029 |
FY2018 Spending Category Chart
