Quick Links
- Statewide Summary
- All Account Listing
- Veto Listing
- Local Aid - Section 3
- Outside Sections
- Downloads
- Budget Glossary
- Helpful Links
| SPENDING CATEGORY |
FY2014 Expended |
FY2015 Expended |
FY2016 Expended |
FY2017 Projected |
FY2018 GAA |
|---|---|---|---|---|---|
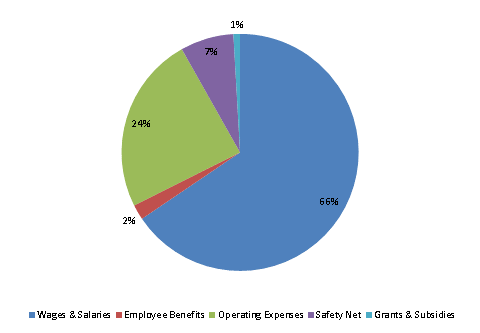
| Wages & Salaries | 144,133 | 151,664 | 145,646 | 145,395 | 155,088 |
| Employee Benefits | 4,160 | 4,619 | 4,463 | 4,787 | 4,909 |
| Operating Expenses | 49,523 | 51,363 | 52,209 | 54,750 | 57,333 |
| Safety Net | 13,794 | 14,762 | 16,773 | 16,563 | 17,221 |
| Grants & Subsidies | 3,916 | 2,873 | 2,815 | 2,493 | 2,132 |
| Debt Service | 0 | 0 | 0 | 138 | 0 |
| TOTAL | 215,526 | 225,282 | 221,905 | 224,126 | 236,684 |
FY2018 Spending Category Chart
