Quick Links
- Statewide Summary
- All Account Listing
- Local Aid - Section 3
- Outside Sections
- Downloads
- Navigation Guide
- Budget Glossary
- Helpful Links
| SPENDING CATEGORY |
FY2008 Expended |
FY2009 Expended |
FY2010 Expended |
FY2011 Projected |
FY2012 GAA |
|---|---|---|---|---|---|
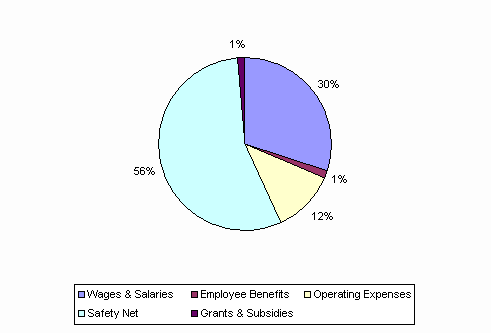
| Wages & Salaries | 380,126 | 376,999 | 343,770 | 333,385 | 353,333 |
| Employee Benefits | 14,765 | 14,653 | 13,100 | 14,788 | 14,701 |
| Operating Expenses | 145,961 | 145,355 | 139,951 | 137,326 | 138,057 |
| Safety Net | 674,728 | 657,309 | 619,419 | 636,612 | 651,889 |
| Grants & Subsidies | 18,367 | 19,265 | 13,605 | 15,284 | 15,012 |
| TOTAL | 1,233,948 | 1,213,582 | 1,129,846 | 1,137,395 | 1,172,991 |
FY2012 Spending Category Chart
