Quick Links
- Statewide Summary
- All Account Listing
- Local Aid - Section 3
- Outside Sections
- Downloads
- Navigation Guide
- Budget Glossary
- Helpful Links
| SPENDING CATEGORY |
FY2008 Expended |
FY2009 Expended |
FY2010 Expended |
FY2011 Projected |
FY2012 GAA |
|---|---|---|---|---|---|
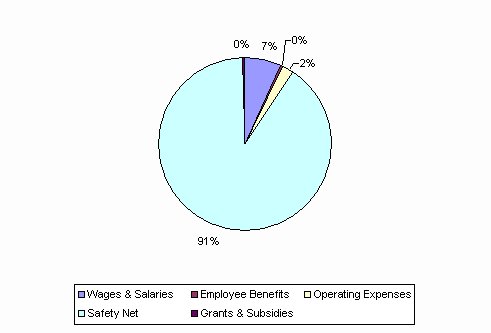
| Wages & Salaries | 1,189,118 | 1,172,946 | 1,117,128 | 1,096,435 | 1,116,161 |
| Employee Benefits | 42,347 | 42,665 | 41,041 | 46,164 | 45,069 |
| Operating Expenses | 379,372 | 376,762 | 369,744 | 367,963 | 371,683 |
| Safety Net | 11,372,379 | 11,850,962 | 12,367,798 | 13,395,452 | 14,637,259 |
| Grants & Subsidies | 44,120 | 36,822 | 38,952 | 33,189 | 33,227 |
| Debt Service | 0 | 0 | 0 | 0 | 0 |
| TOTAL | 13,027,336 | 13,480,157 | 13,934,663 | 14,939,203 | 16,203,399 |
FY2012 Spending Category Chart
