Quick Links
- Statewide Summary
- All Account Listing
- Local Aid - Section 3
- Outside Sections
- Downloads
- Navigation Guide
- Budget Glossary
- Helpful Links
| SPENDING CATEGORY |
FY2008 Expended |
FY2009 Expended |
FY2010 Expended |
FY2011 Projected |
FY2012 GAA |
|---|---|---|---|---|---|
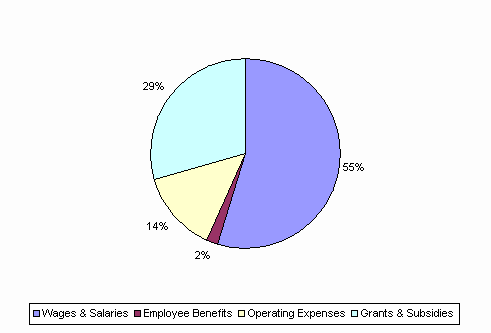
| Wages & Salaries | 22,117 | 21,779 | 20,285 | 19,865 | 18,341 |
| Employee Benefits | 587 | 581 | 530 | 642 | 633 |
| Operating Expenses | 5,434 | 5,396 | 4,594 | 5,059 | 4,670 |
| Grants & Subsidies | 48,111 | 35,410 | 16,487 | 41,812 | 9,878 |
| TOTAL | 76,249 | 63,166 | 41,896 | 67,378 | 33,522 |
FY2012 Spending Category Chart
